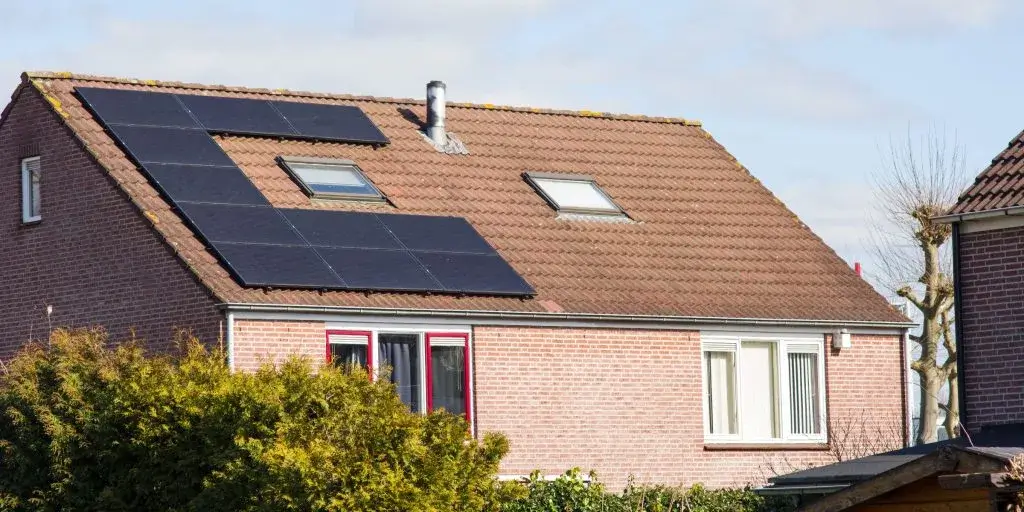


Solar energy is becoming more popular in Ireland, with more homeowners and businesses choosing solar panels to cut energy costs and reduce their carbon footprint. Despite this growth, the rate of solar installations varies across different counties. Some areas are adopting solar energy at a much faster rate, while others are slower to catch up.
In this blog, we explore the number of solar panel installations per capita across Ireland in the first half of 2024. Using data from SEAI and Census 2022, we highlight which counties are leading the way and which ones have the lowest adoption rates.
If you’re considering installing solar panels in 2025, this blog will help you understand regional trends and the growing shift towards renewable energy in Ireland.
Which Counties Install the Most Solar Panels Per Capita?
Dublin has one of the lowest solar panel installation rates per person in Ireland. Surprisingly, only one county from the “sunny southeast” made it into the top five, while three counties in Ulster are in the bottom five.
Does Solar Panel Installations Remain Strong Despite Grants Changes?

Even though SEAI adjusted solar grants in early 2024, the number of solar panel installations across Ireland remains high. In the second quarter of the year, 7,493 grant-assisted solar PV systems were installed, marking a 24% increase (almost 1,500 more) compared to the first quarter.
Given that Dublin and Cork have the largest populations, it makes sense that they also have the highest number of total installations. However, when adjusting for population size, some counties are performing better than others.
So, which counties have the highest and lowest solar installation rates per capita?
To find out, we have analysed SEAI data on solar PV installations in each county during the first half of 2024. We also factored in population data from the most recent Census. The results are quite revealing.
Top 5 Counties for Solar Installations Per Capita

Here are the counties with the highest number of solar PV nstallations per 10,000 people in the first half of 2024
- Meath – 36.14 installations per 10,000 people
- Louth – 35.52 installations per 10,000 people
- Clare – 34.93 installations per 10,000 people
- Wexford – 33.94 installations per 10,000 people
- Galway – 33.83 installations per 10,000 people
Meath leads the way, with neighbouring Louth following closely behind. Interestingly, despite being one of Ireland’s sunniest regions, only one county from the “sunny southeast” (Wexford) made it into the top five.
Counties such as Carlow and Kilkenny made the top 10, but Waterford is in the middle of the rankings, and Cork doesn’t appear until 18th place. However, all of the top five counties are also in the top 10 for the highest number of sunshine hours in Ireland.
Bottom 5 Counties for Solar Installations Per Capita
At the other end of the scale, these counties had the lowest number of solar installations per 10,000 people:
- Longford – 16.08 installations per 10,000 people
- Monaghan – 18.98 installations per 10,000 people
- Donegal – 19.60 installations per 10,000 people
- Cavan – 20.30 installations per 10,000 people
- Dublin – 22.04 installations per 10,000 people
Longford had less than half the number of installations compared to the top five counties, with only 74 installations in total in the first six months of 2024.
Three Ulster counties—Monaghan, Donegal, and Cavan—also feature in the bottom five. Interestingly, both Longford and Cavan rank among the worst-performing counties for Building Energy Ratings (BER), with just 5% of buildings achieving an ‘A’ rating.
Dublin’s low per capita ranking is partly due to its large population and high number of apartments, making solar panel installations less common. According to Census 2022, only 3% of households in Dublin City had solar panels, compared to 11% in Meath. This trend appears to have continued in 2024.
Solar Installations per Capita

Solar Installations per 10,000 people in the first half of 2024
- Co. Meath – 36.14
- Co. Louth – 35.52
- Co. Clare – 34.93
- Co. Wexford – 33.94
- Co. Galway – 33.83
- Co. Wicklow – 33.5
- Co. Sligo – 32.52
- Co. Kilkenny – 31.88
- Co. Carlow – 31.26
- Co. Kildare – 29.24
- Co. Tipperary – 27.69
- Co. Kerry – 27.49
- Co. Waterford – 27.3
- Co. Mayo – 27.08
- Co. Offaly – 25.81
- Co. Roscommon – 25.76
- Co. Limerick – 25.7
- Co. Laois – 24.95
- Co. Cork – 24.87
- Co. Westmeath – 24.52
- Co. Leitrim – 23.02
- Co. Dublin – 22.04
- Co. Cavan – 20.3
- Co. Donegal – 19.6
- Co. Monaghan – 18.98
- Co. Longford – 16.08
If you’re looking for solar installation services, My Power is here to help. Whether you’re in a high-adoption area like Meath or an emerging solar region, we provide expert guidance, top-quality installations, and assistance with grants to make your switch to renewable energy smooth.
Our team ensures a hassle-free process, from consultation to installation, helping you save on energy bills while reducing your carbon footprint. No matter where you are, My Power is committed to bringing efficient and affordable solar solutions to every home and business.
Conclusion!
Solar panel installations are increasing across Ireland, but some counties are adapting the change faster than others. Meath, Louth, and Clare lead the way with the highest number of installations per capita, while counties like Longford and Monaghan have the lowest uptake. Factors such as population size, housing types, and energy awareness influence these trends.
If you’re considering solar energy for your home or business, My Power can guide you through the process. Get expert advise on grants, installation, and savings.
Contact My Power today to start your journey towards cleaner, more affordable energy!
FAQ’s
Which counties install the most solar panels per capita?
County Meath ranks highest, with 36.14 solar installations per 10,000 people in the first half of 2024. Louth and Clare follow closely behind.
Why is Dublin among the counties with the lowest solar panel installations per capita?
Dublin has a high population and a large number of apartments, which are less suitable for solar panel installations. In Census 2022, only 3% of Dublin City households reported having solar panels.
Why does the ‘sunny southeast’ not dominate the top solar panel installation rankings?
Despite receiving the most sunshine hours, only Wexford makes the top five. Other counties in the region, like Waterford and Kilkenny, are further down the list.
Which counties have the lowest number of solar installations per capita?
Longford has the lowest installation rate, with only 16.08 installations per 10,000 people. Monaghan, Donegal, Cavan, and Dublin also rank among the bottom five.
What might be causing lower solar panel adoption in some counties?
Factors such as housing types, energy awareness, and lower Building Energy Ratings (BER) impact adoption. Longford and Cavan, for example, have fewer energy-efficient homes.
How have solar installations in Ireland changed in 2024?
Despite changes to SEAI grants, solar panel installations increased by 24% in Q2 2024, with nearly 7,493 new systems installed across the country.